.jpg)
Weather policy
The Match Committee of Zone 14 Bowling Association has adopted the following Weather Policy. It relates to weather conditions affecting all Association events and is to be used as a guideline to determine the suspension, abandonment and rescheduling of play in them.
- In all cases, the health and safety of players should be the prime consideration
- Clubs are responsible for having in place their own rules for a weather policy.
- Any Club hosting a Zone 14 event will observe the contents of the Bowls Australia Weather Policy, approved February, 2014 found on the website www.bowlsaustralia.com.au and have a copy for reference
- It is recommended to have a portable calibrated weather station and/or computer to access information from the Bureau of Meteorology website www.bom.gov.au. Alternatively, use the www.weatherzone.com.au website, or the Pocket Weather Australia application available for both iPhone and android smartphones.
- Lightning usually presents the greatest risk and after its initial recognition, all those in exposed areas should be seeking or already be inside safe shelters. It is advisable to wait 30 minutes after the last sighting of lightning or sound of thunder. This allows the thunderstorm to pass, thus minimising the risk, as blue skies and lack of rain are not adequate reasons to return to playing.
- If wind intensity is sufficient to move stationary objects (i.e. a jack or a bowl), play should be suspended until the wind abates or abandoned if it appears that abatement is unlikely.
- In cases of extreme heat and/or heat and humidity reference should be made to the “Beat the Heat” fact sheet produced by Sports Medicine Australia (particularly the tables on p4) – http://sma.org.au/wp-contents/uploads/2011/03/beat-the-heat-2011.pdf
As a guide only, the table below demonstrates the impact of relative humidity on “sensed” temperature
| Relative | Air Temperature (C) | ||||||
| Humidity | 21 | 24 | 27 | 29 | 32 | 35 | 38 |
| 0% | 18 | 21 | 23 | 26 | 28 | 31 | 33 |
| 10% | 18 | 21 | 24 | 27 | 29 | 32 | 35 |
| 20% | 19 | 22 | 25 | 28 | 31 | 34 | 37 |
| 30% | 19 | 23 | 26 | 29 | 32 | 36 | 40 |
| 40% | 20 | 23 | 26 | 30 | 34 | 38 | 43 |
| 50% | 21 | 24 | 27 | 31 | 36 | 42 | 49 |
| 60% | 21 | 24 | 28 | 32 | 38 | 46 | 56 |
| 70% | 21 | 25 | 29 | 34 | 41 | 51 | 62 |
| 80% | 22 | 26 | 30 | 36 | 45 | 58 | |
| 90% | 22 | 26 | 31 | 39 | 50 | ||
| 100% | 22 | 27 | 33 | 42 | |||
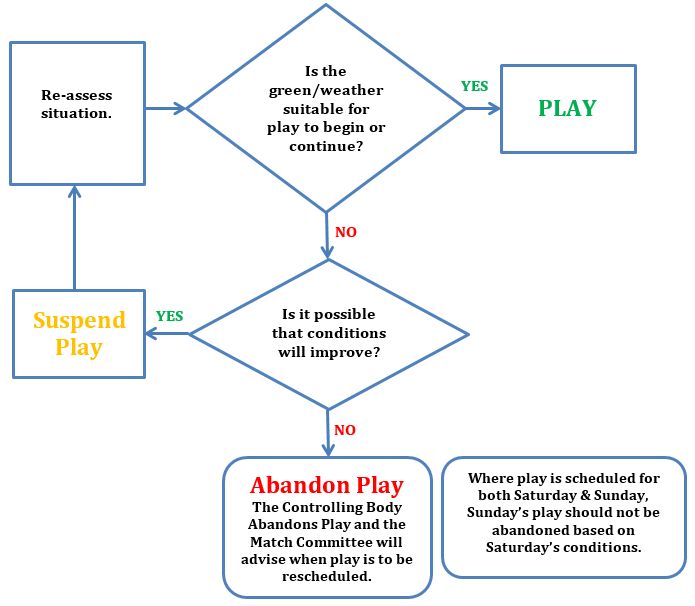
8. The following guideline illustration will assist Officials determine the order of action to take.
 To download/save/print copy of policy click here